Shortly after games end, we simulate the entire regular season and playoffs many thousands of times to obtain the probability of various outcomes. During live games, we simulate each game many thousands of times on demand (i.e. whenever you load a live game page in /games) to give you the most up-to-date and accurate results. This article explains how these simulations work.
Model Overview
The model combines several key components to project game outcomes:
Expected Goals
Extreme gradient boosting model to determine shot-to-goal probability
Player Impact (RAPM)
Ridge regression to isolate individual player contributions
Ice Time Estimates
Projected TOI% at even strength, power play, and penalty kill
Shooting & Goaltending
Individual shooter and goaltender impact estimates
Offensive & Defensive Impact
I then used a prior-informed ridge regression (RAPM) to obtain a point estimate of the impact that each skater has on the rate at which their team generates and allows shots and expected goals for and against at even strength, shots and expected goals for on the power play, and shots and expected goals against on the penalty kill.
Shooting & Goaltending Impact
In order to obtain a point estimate of the impact that each skater has on the probability of their own shots becoming goals, and that each goaltender has on the probability of shots they face becoming goals, I followed a very similar process but instead used a non-prior informed (vanilla) ridge regression. This captures the individual shooting talent of skaters beyond what's explained by shot quality.
Multi-Year Forecasting
I repeated the regression process for every NHL season from 2007-2008 through 2024-2025. I then ran a linear regression on each of these seasons to obtain coefficient estimates that would provide me with the proper weights to place on years 1, 2, and 3 in order to most accurately forecast a player's performance in year 4, and then applied this to every NHL skater who played over each of the past 3 seasons.
Handling Limited Sample Sizes
- 3 years of data: Full weighted projection using years 1, 2, and 3
- 2 years of data: Separate weights using only years 1 and 2 to predict year 3
- 1 year of data: Copy and paste their estimated impact from last season
Goaltender Projections
I initially planned on using the same process for goaltenders but found in testing on prior seasons that goaltender performance was not very repeatable from year-to-year, and that my projected goaltender performance played a much larger role in explaining variance in my projected standings than it did in the actual NHL standings.
This led me to "place less weight" on goaltending by repeating a similar process to the one I did with skaters but instead directly obtaining the fitted values from a linear regression, which pulled the projected performance of every goaltender much closer to zero. This improved the performance of the model in testing on prior seasons.
Converting Rates to Playing Time
Every projected value that I obtained came in the form of a rate; for the play-driving components the rate was per-minute, and for the shooting and saving components it was per-shot. Not all skaters will play the same number of minutes and not all skaters will take the same percentage of their team's shots when they are on the ice, which makes these numbers useless without an idea of how much they will play and shoot next season.
Ice Time Estimation
In order to estimate the number of minutes that each skater will play, I repeated the above process using every player's time-on-ice percentage (TOI%) in order to project their TOI% and then adjusted this percentage based on the projected TOI% of all of their teammates to determine a proper estimate of how much each player will actually play.
Game Strength Breakdown
I then multiplied their projected TOI% at each game strength by the percentage of time I projected teams to play at each game strength — roughly 90% at even strength and 10% on special teams, distributed evenly between power play and penalty kill — and then multiplied their projected per-minute impact at each game strength by the minutes that I projected they would play at that game strength.
Shot Share Estimation
In order to estimate the percentage of their team's shots that each skater will take, I essentially repeated this process for shots and obtained an estimate of the percentage of their team's shots that each player will take. I then multiplied the percentage of their team's shots that I projected each shooter would take by the projected impact that each shooter has on their shots becoming goals.
Building Team Components
For each team, I use projected lineups directly from Daily Faceoff.
The Six Core Components
I summed up the projected impact on each component of the game for every player on each team. This summation provided me with a team's isolated impact on the following six components:
Shots For
Impact per-60 minutes on shot generation
Shots Against
Impact per-60 minutes on shot suppression
Expected Goals For
Impact per-60 minutes on xG generation
Expected Goals Against
Impact per-60 minutes on xG suppression
Shooting
Impact per-shot on goal probability
Goaltending
Impact per-shot on save probability
These six components make up the "guts" of the model.
Simulating Individual Games
To determine the rate at which each team would take shots and score goals on those shots, I merged the projected impact of each team with the corresponding impact of their opponent to determine the overall impact that each team would have on those components, and then added this to the league-average rate that teams take shots and score goals.
Example Game Calculation (Fictional Data)
For the sake of brevity, this example focuses only on the offense of the home team:
- League average: Teams take 44 shots and score 3 goals per-60 minutes
- Home ice advantage: Increases hourly shooting rate by 1 shot and goal rate by 0.3
- Home team impact: +5.0 on shots for; Away team: -1.0 on shots against
- xG impact: Home: +0.3 on xGF; Away: -0.1 on xGA
- Shooting/goaltending: Home shooters: +0.1% on goal probability; Away goaltending: -0.01%
Before quality adjustment: The home team should take 49 shots per hour and score 3.5 goals per hour, meaning they should score on 7.14% of their shots.
After quality adjustment: They should score on 7.23% of their shots.
This process is repeated for the home and away team for every single game to obtain the rate at which they will take shots and score on the shots they take. Once these values are acquired, the simulation is ready to be run.
The Simulation Process
I start the simulation by creating a dataframe in R with 3,600 rows and 2 columns. Each row represents a second of the game I'm simulating, and each column contains a random estimate of whether a team will take a shot or not based on the rate at which they shoot; there is one column for each team's shots.
If a team does take a shot, I estimate whether that shot will become a goal based on the rate at which they score on their shots. Once this process is complete for every row, the number of goals scored by each team is summed and if one team has scored more, a winner is declared.
Overtime Simulation
If both teams have scored the same number of goals, I create an additional dataframe with 600 rows and 2 columns in order to simulate overtime. The first team to score in overtime wins the game, and if neither team scores within 600 seconds of overtime, a winner is randomly declared with each team being provided with a win probability of 50%.
Model Validation
When initially building the model, I tested the model on the 2019-2020 season following the same process and used log loss and average error between projected standings points per 82 games and actual standings points per 82 games.
Log Loss
~0.678
Game-by-game prediction accuracy
Average Error
~8.1 points
Standings points per 82 games
The test was slightly different from a true and proper test; I was simultaneously at an unfair advantage because I had access to the first team that a player played for and an unfair disadvantage because I was not updating lineups every game. I take my results with a grain of salt due to this, but still feel confident based on the results that the model performs well.
Historical Model Results
The model was deployed starting in the 2020-2021 season and performed quite well against other public models. During the 2021 Stanley Cup Playoffs, the model finished with the lowest log loss among all tracked models, correctly giving the Tampa Bay Lightning the highest probability of winning the Cup.
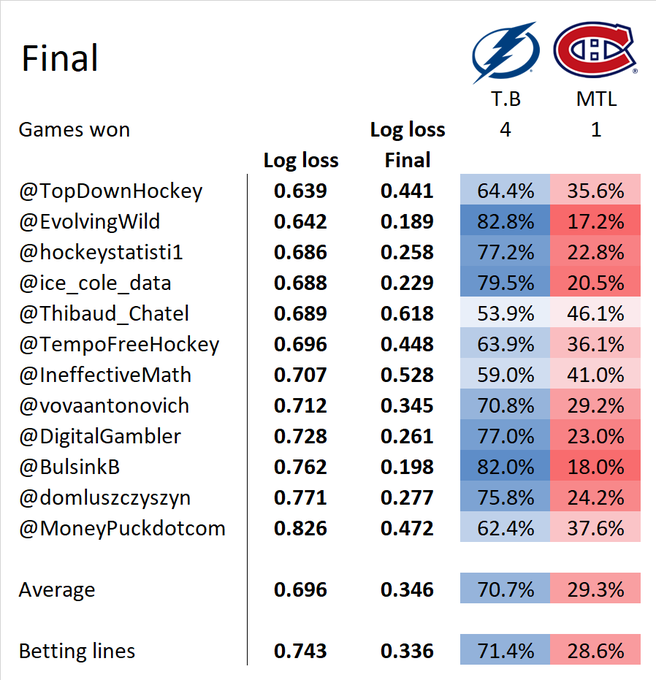
2021 Playoffs: Model comparison by log loss — tracked by @HockeySkytte on Twitter.
Playoff Odds & Standings Projections
Using the same game simulation model described above, each day I simulate the remainder of the NHL regular season, along with the entirety of the Stanley Cup Playoffs (based on my simulated regular season) 1 million times.
The probabilities which I report — such as Make Playoff Probability, Stanley Cup Probability, etc. for each team — are the empirical frequencies at which these outcomes are observed across all simulations. The projected points are the mean point totals per team across all of the 1M simulations.